Bottom marine heatwaves along the continental shelves of North America
The following summarizes work published in Nature Communications
See also our recent Nature Comment on marine heatwave definitions
Major Results:
Marine heatwaves unfold along the sea floor and have intensities and durations that strongly vary with ocean bottom depth.
Bottom marine heatwaves can be more intense and often last longer than their surface counterparts.
Bottom marine heatwaves can occur without a clear surface signature.

There has been substantial effort to understand the fundamental characteristics of warm ocean temperature extremes—known as marine heatwaves (MHWs). However, MHW research has primarily focused on the surface MHWs (SMHWs). In this study, we use a high-resolution (~8 km) ocean reanalysis to assess bottom marine heatwaves (BMHWs) along the continental shelves of North America.
Results:
Average BMHW intensity and duration vary strongly with ocean bottom depth (Figs. 1-2).
Intensity and duration variations are often tied to distinct bathymetric features (e.g., Gulf of Maine in the NEUS).
Average intensities as high as 5˚C in southern California Current and Gulf of California LMEs!

Figure 1 Average BMHW intensity in nine Large Marine Ecosystems (LMEs) around North America. Results shown for ocean grid cells with bottom depths shallower than 400m.
Figure 2 As in Figure 1, but for average BMHW duration.

Results:
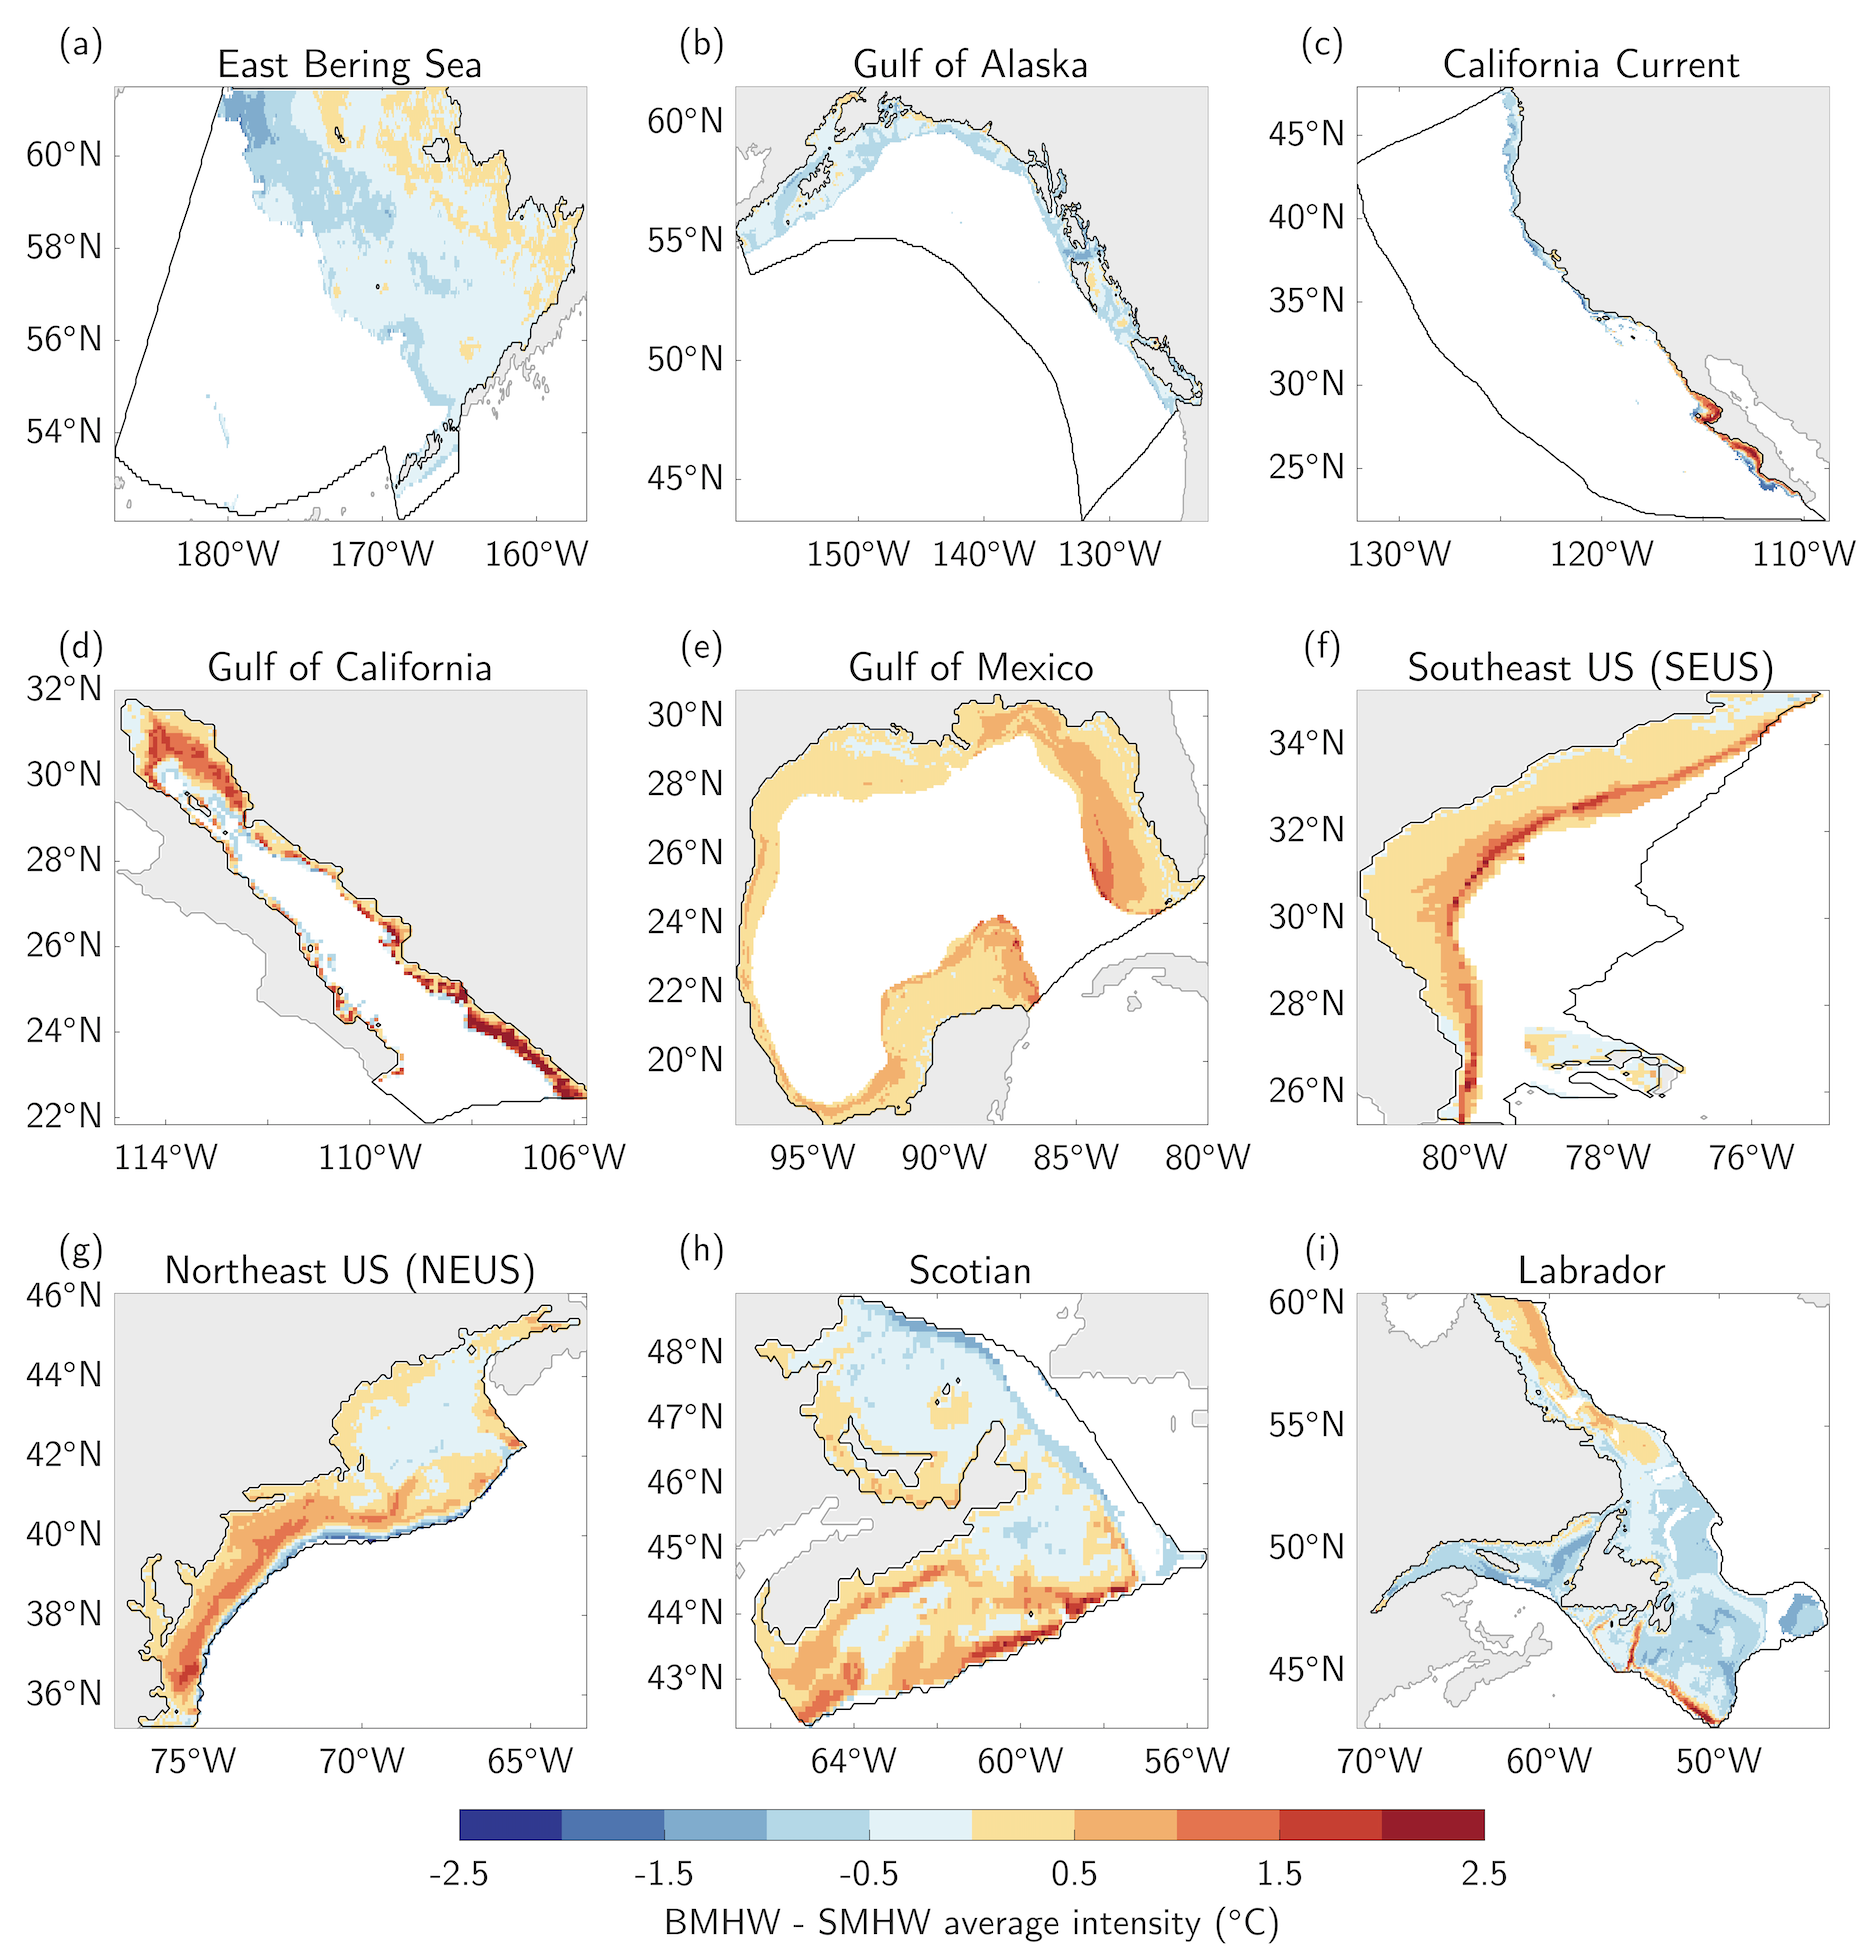
BMHWs can be more intense than their SMHW counterparts, especially in the southern California Curren System, the Gulf of California, and the Mid-Atlantic Bight (Figs. 3-4).
BMHWs typically last longer than SMHWs almost everywhere. This is related to the longer decorrelation timescale of bottom vs. surface ocean temperatures.
Figure 3 Difference between average BMHW and average SMHW intensity.
Figure 4 Difference between average BMHW and average SMHW duration.


Figure 5 Schematic depicting possible synchrony between BMHW and SMHW driven by mixed layer depth (MLD) variability. Light dashed line is the shallowest MLD for a given region. Dark dashed line is the deepest MLD for a given region. Circles indicate example locations on a continental shelf that fall above the shallowest MLD (green), within the range of MLD variability (yellow), and below the maximum MLD (red).
Figure 6 BMHW/SMHW temporal synchrony versus the ratio of MLD/bathymetric depth for each grid cell within each LME. Synchrony = 1 means BMHW & SMHW co-occur 100% of the time. MLD/Bathy = 1 means the MLD is hitting the ocean floor. Correlations are in bottom right corner.
Results:
BMHWs and SMHWs tend to co-occur in shallow regions of the continental shelf where the MLD routinely reaches the ocean floor.
In deeper portions of the shelf, BMHWs can occur without a clear surface signature (Figs. 5-6).