2026-2027 El Niño Updates
Throughout the evolution of the ongoing Super El Niño, I will post updated observations and predictions of Coastal Trapped Waves (CTWs) as they propagate up the coastlines of South America, Central America, Mexico, and the United States.
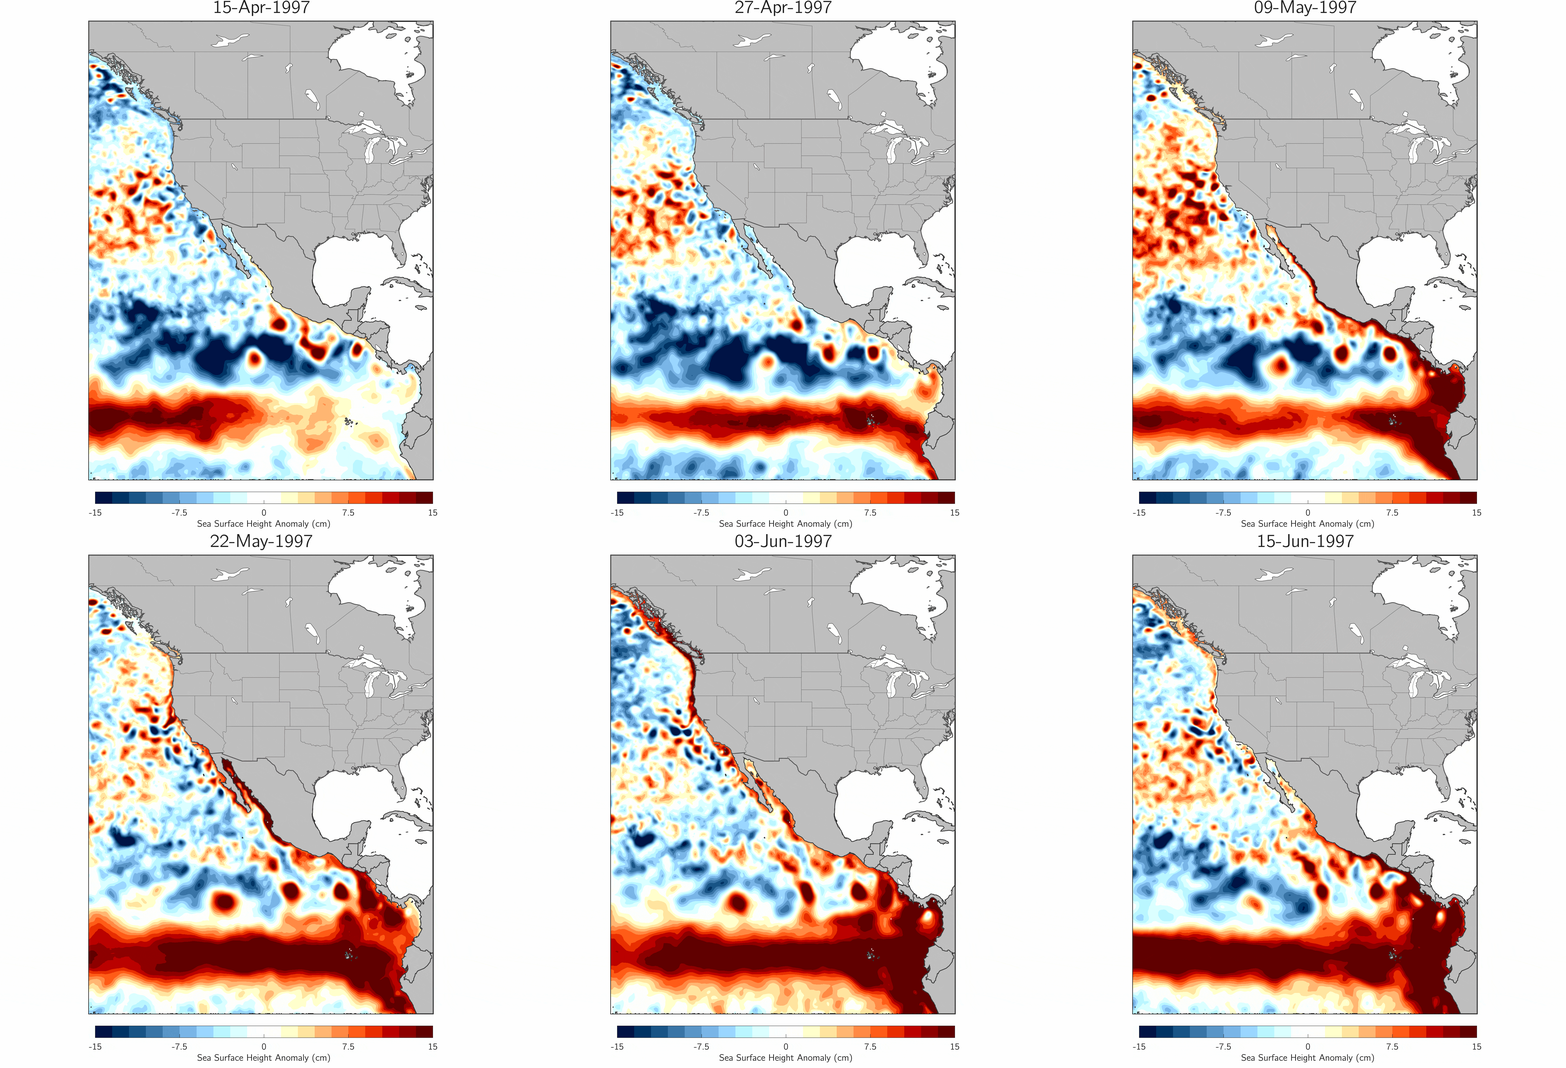
Already, there is observational evidence of strong CTWs propagating from the equatorial Pacific to as far north as Washington. See below for Hovmöller diagrams (updated daily!) that show the development of these waves in time and space as well as animations of CTWs slithering up the coast.
Coastal Trapped Waves Frequently Asked Questions:
Q: What is a Coastal Trapped Wave (CTW)?
A: A coastal trapped wave is a propagating disturbance characterized by higher-than-normal sea levels. These waves are “trapped” to the coast due to the rotation of the Earth and the Coriolis force, which deflects elevated surface waters back into the coastline as they try to move offshore and poleward.
Q: How do CTWs form?
A: Coastal trapped waves are often associated with equatorially trapped Kelvin waves, which form in the far western equatorial Pacific in response to westerly wind bursts. These wind bursts weaken the background trade winds, allowing warm water and elevated sea states found in the western equatorial Pacific to “slosh” back toward the eastern equatorial Pacific as equatorially trapped Kelvin waves. These Kelvin waves are a critical component of El Niño development. When the waves arrive at the South America, they continue to propogate up the coastline as CTWs in both the Northern and Southern Hemispheres. The CTWs will continue to follow the contour of the coast, around bays, coves, and inlets, for thousands of miles. In total, these waves travel +25,000 km over ~120 days, from the western equatorial Pacific all the way to the Gulf of Alaska.
Q: Why do we care about CTWs?
A: Coastal trapped waves can raise background sea levels by 6-12 inches, depending on the strength of the wave. When combined with high tides and/or storms, CTWs can significantly increase the risk of coastal flooding and beach erosion. Additionally, CTWs suppress upwelling along the US west coast, warming the ocean and contributing to marine ecosystem impacts. In total, we usually expect 5-6 major CTWs during the life of an El Niño, with the largest waves typically occurring during the winter.
Q: How do we track CTWs? Are CTWs predictable?
A: We currently track CTWs using observational products that combine real-time ocean measurements with computer simulations to generate a complete picture of how sea surface heights are evolving around the globe. CTWs are predictable! They travel at a known speed of ~2.7 m/s or ~6 mph. As a result, once we identify that a wave has kicked off, we usually have a good sense for when it will arrive at a particular location.
Q: Where can I download the CTW animations and/or the underlying data?
A: You can download the latest CTW animations here and here. They update daily when new data rolls in. You can also download a classic CTW example from the 1997/1998 El Niño here. If you use these animations for publications, I just ask that you properly credit me as the source and please email me to let me know. You can download the underlying data for the latest CTW animation as a NetCDF file here.
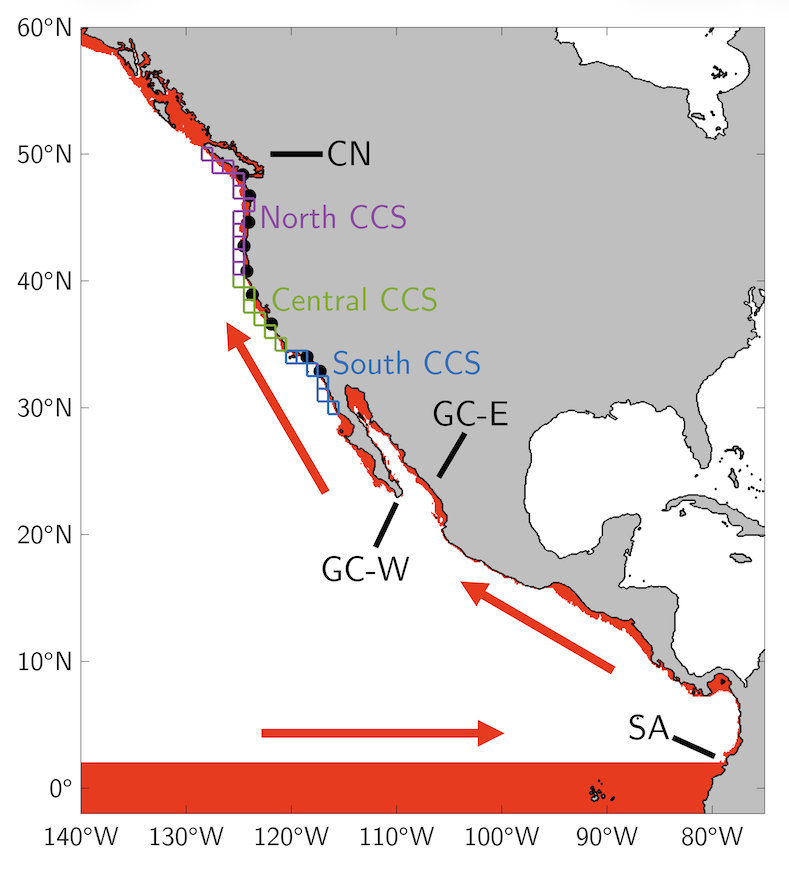
The path an equatorial Kelvin wave travels from the West Pacific to the East Pacific before converting to a coastal trapped wave (CTW) that propagates northward along the South American (SA) coastline and up the coast of Central America and Mexico, entering the Gulf of California along the east coast (GC-E) and exiting along the west coast (GC-W), finally traveling along the US west coast before crossing the border into Canadian waters (CN).
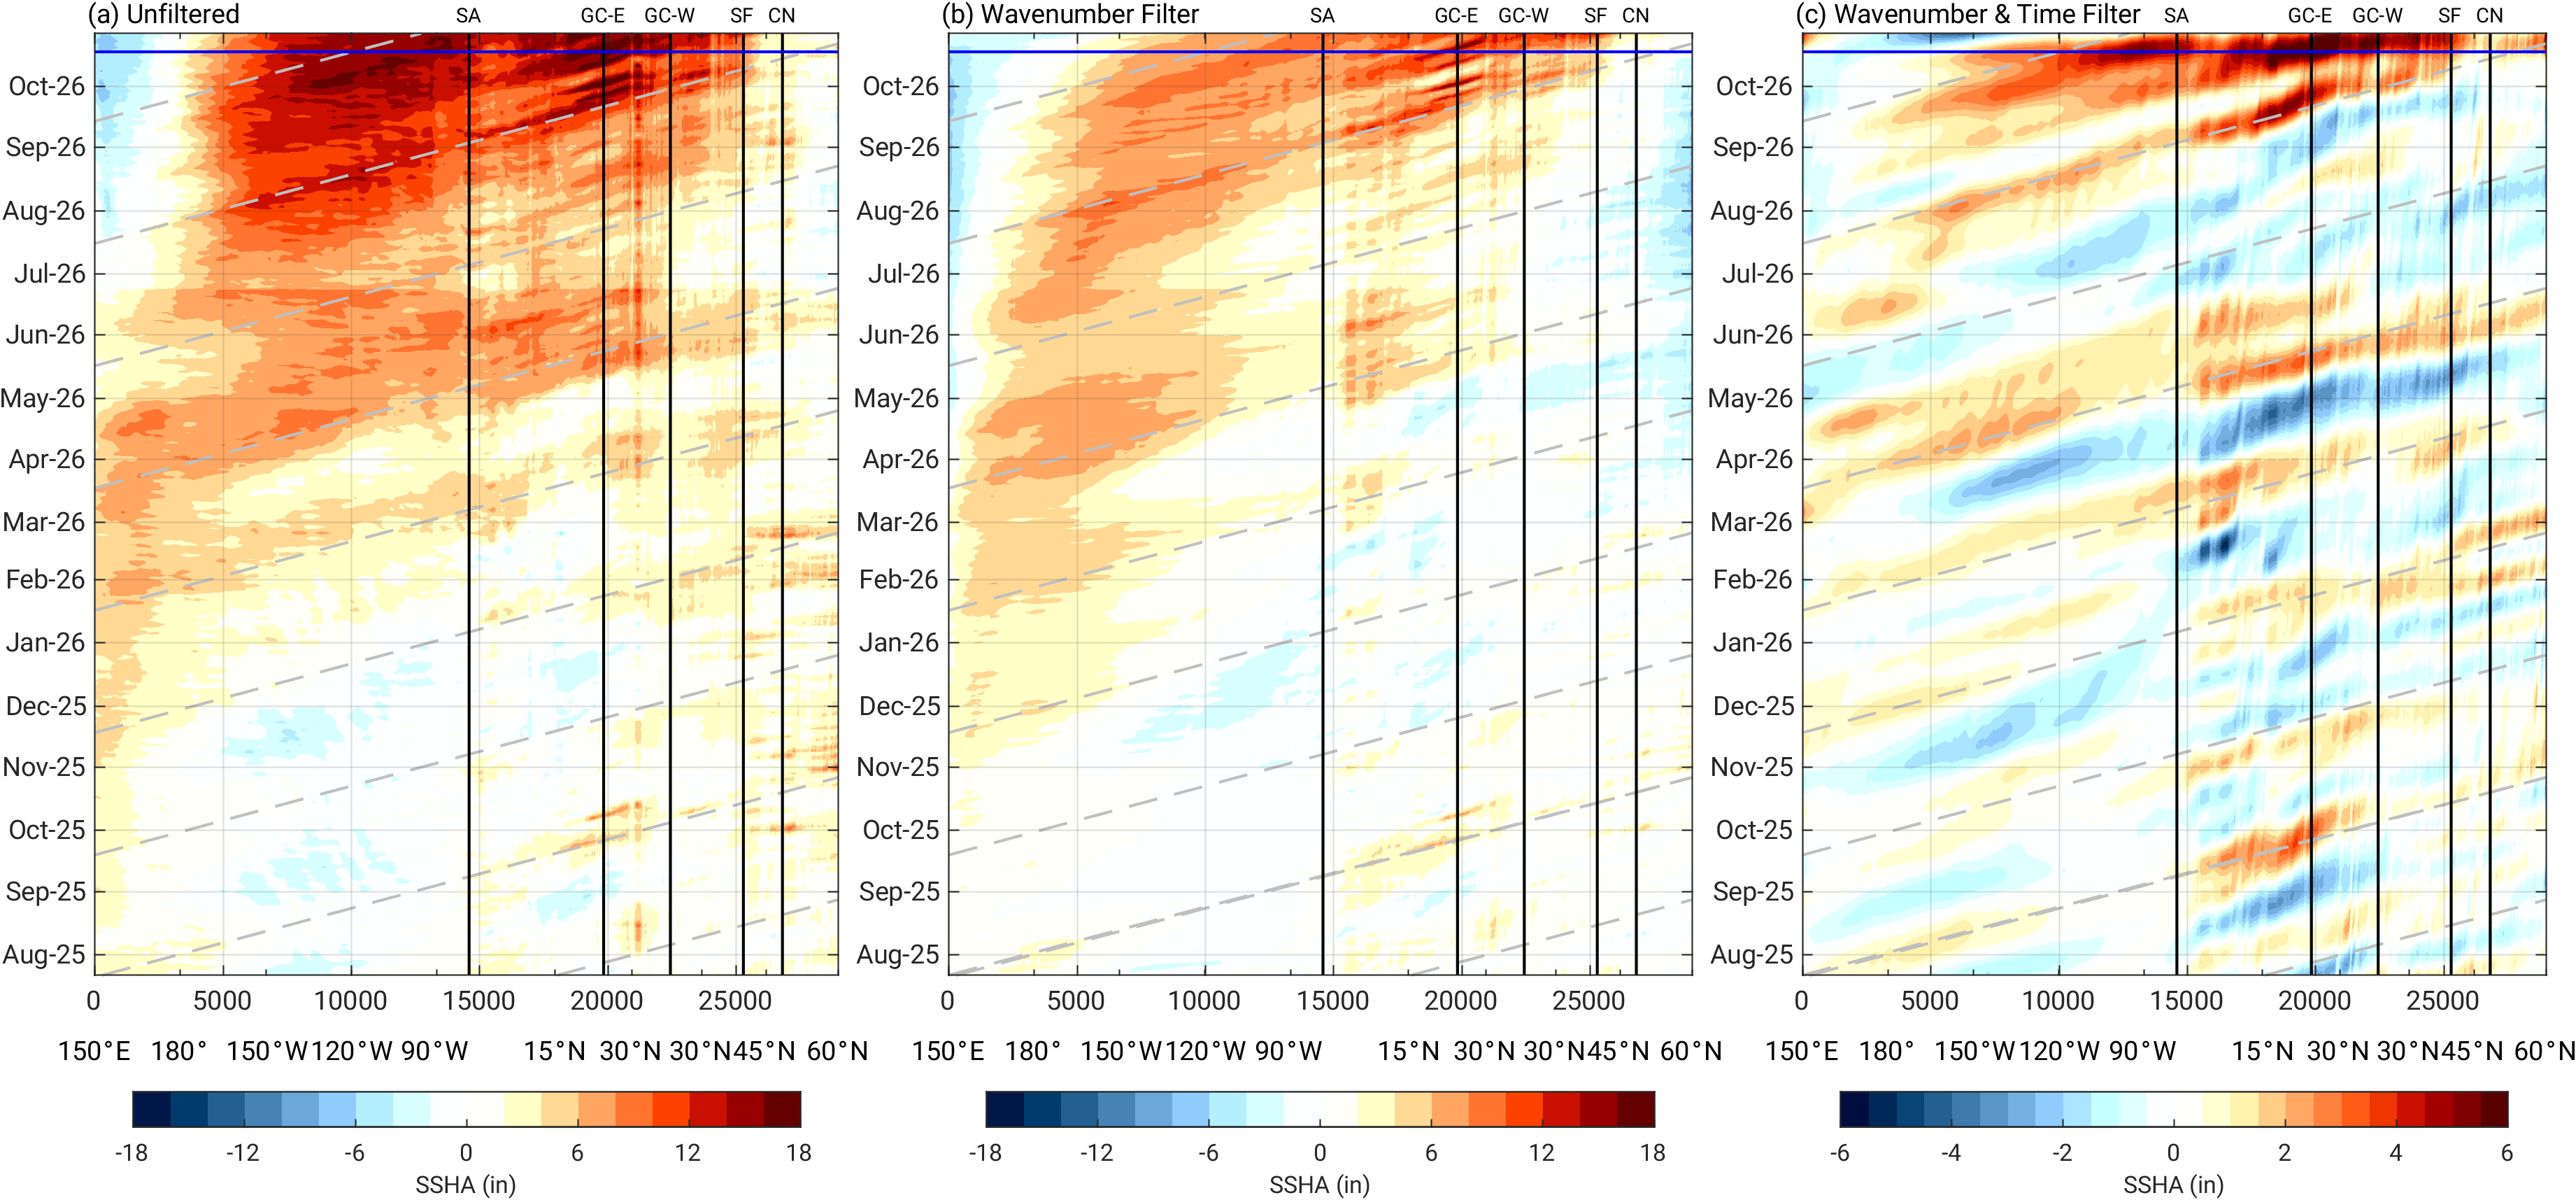
Realtime Coastal Trapped Wave (CTW) Hovmöller, valid for XXXX – XXXX. Updated daily!
Updated colorbar and units (10/13/26)
(a) Unfiltered, (b) wavenumber filtered, and (c) wavenumber and time filtered sea surface height (SSH) anomalies (inches) along the red CTW pathway shown to the left. Vertical black lines correspond to geographical waypoints, with "SF" marking San Francisco. Blue line denotes the present day and the beginning of the forecast period. Dashed gray lines indicate a phase speed of 2.7 m/s. Upper x-axis marks the distance along the pathway in kilometers. Lower x-axis marks the approximate latitude/longitude coordinates at select locations along the path. Anomalies are relative to a 1993-2025 baseline. Data source: GLORYS ocean reanalysis, analysis, and forecast products.


Realtime Coastal Trapped Wave (CTW) Animations. Updated daily!
Unfiltered sea surface height anomalies for the (left) equatorial and Northeast Pacific and (right) the US West Coast. Animations runs for the previous 45 days from the end of the GLORYS forecast. Anomalies are relative to a 1993-2025 baseline. Data source: GLORYS ocean analysis and forecast products.
Subseasonal-to-seasonal forecast skill in the California Current System and its connection to coastal Kelvin waves
The following summarizes work published in JGR: Oceans
Major Results:
The ECWMF S2S forecasting model skillfully predicts sea level along the US west coast from Weeks 3-7.
The presence of coastally trapped waves at initialization enhances overall forecast skill.
We have developed a coastal Kelvin wave index to capture the location and amplitude of these waves as they propagate up the North American coastline in real-time.